In the world of technical analysis, chart patterns are critical tools for predicting price movements. One of the most reliable and frequently used formations by professional traders is the Cup and Handle Pattern. This bullish continuation pattern often signals a strong opportunity for upward price movement and can be a key element in successful trading strategies.
Whether you are a beginner in trading or an experienced investor, understanding how to identify the Cup and Handle Pattern can help you make smarter entry points and boost your potential returns. In this post, we’ll break down what the Cup and Handle Pattern is, how to spot it on stock charts, and how to trade it effectively.
📌 What is the Cup and Handle Pattern?
The Cup and Handle Pattern is a classic bullish chart pattern that resembles the shape of a tea cup. It consists of two parts:
- Cup: A rounded “U” shape that resembles a bowl or base, indicating a period of consolidation followed by a gradual recovery.
- Handle: A slight downward drift after the cup is formed, which often looks like a small flag or channel.
Once the handle completes and the price breaks above resistance, it’s typically a signal that the stock may enter a new bullish phase.
✅ Key Characteristics of the Cup and Handle Pattern
To correctly identify the pattern, look for the following characteristics:
- Prior Uptrend: The pattern usually appears after a strong prior uptrend, acting as a continuation signal.
- Cup Formation: A rounded bottom that lasts several weeks or even months. The depth should be moderate—not too deep.
- Handle Formation: A short consolidation phase or pullback, typically lasting a few days to a few weeks.
- Breakout Point: When the price breaks above the resistance level (the rim of the cup), this is the buy signal.
- Volume Confirmation: Ideally, volume should decrease during the handle formation and spike at the breakout.
🔍 How to Identify Cup and Handle Pattern on a Chart
Spotting a Cup and Handle pattern requires a sharp eye and some experience with chart reading. Here are the steps to identify it:
1. Start with a Daily or Weekly Chart
Use daily or weekly candlestick charts for better pattern clarity, especially if you’re analyzing mid to long-term trends.
2. Look for the Cup Shape
Identify a rounded bottom. The decline and rise should be symmetrical or nearly equal in depth. Avoid patterns that form a sharp “V”—a proper cup should be more “U” shaped.
3. Spot the Handle Formation
Once the cup is complete, prices should consolidate sideways or drift slightly lower, forming a handle. This handle should stay in the upper third of the cup.
4. Identify the Breakout Zone
Draw a horizontal resistance line at the cup’s high point. When price breaks above this level with volume confirmation, it often indicates a strong breakout.
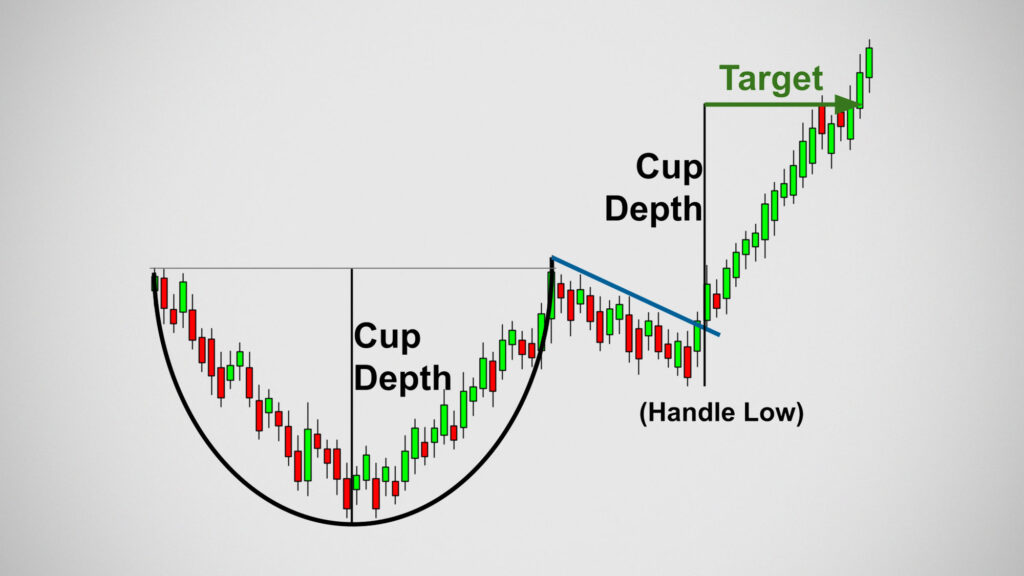
5. Measure the Target
To estimate the target price, measure the depth of the cup and add it to the breakout level.
Example:
If the cup depth is ₹50 and the breakout point is ₹300, the target would be around ₹350.
📊 Real-World Example
Let’s consider a hypothetical scenario:
- Stock: ABC Ltd.
- Cup formed between: ₹250 and ₹300 (over 6 weeks)
- Handle forms around: ₹285 to ₹295 (over 2 weeks)
- Breakout Level: ₹300
- Volume Spike: On breakout day, volume is 3x the average.
This setup would indicate a bullish breakout, and traders may set their targets around ₹350, with a stop-loss just below the handle at ₹285.
🧠 Tips for Trading the Cup and Handle Pattern
- Wait for Confirmation: Never enter a trade before the breakout above resistance.
- Set Stop Losses: Use stop-loss orders just below the handle or recent swing low to manage risk.
- Volume is Key: Higher volume on breakout increases the reliability of the pattern.
- Use With Other Indicators: Combine with RSI, MACD, or moving averages for added confirmation.
⚠️ Common Mistakes to Avoid
- Mistaking a V-Shape for a Cup: A sharp dip and rebound is not a valid cup.
- Entering Too Early: Avoid entering during the cup or early handle phase; wait for a breakout.
- Ignoring Market Trends: Always consider the broader market environment—bullish patterns work better in bullish markets.
🔎 Why the Cup and Handle Pattern Matters for AngelOne Traders
As a partner of AngelOne Limited, our goal at asbfinance.in is to empower traders and investors with actionable insights. The Cup and Handle pattern offers an edge in identifying potential breakout stocks. With AngelOne’s advanced charting tools and trading platform, you can easily track this pattern in real-time.
📚 Final Thoughts
The Cup and Handle Pattern is a powerful chart setup that can signal strong upward price movements when properly identified and executed. By understanding its structure, patiently waiting for confirmation, and using smart risk management, you can greatly improve your trading outcomes.
At asbfinance.in, we aim to educate and assist Indian traders in making informed decisions. Partnered with AngelOne Limited, we bring you the best trading tools, knowledge, and real-time alerts to stay ahead in the markets.
📥 Ready to Trade Smarter?
Open your free Demat and Trading Account with AngelOne today and start identifying profitable patterns like Cup and Handle with ease!
👉 Start Trading with AngelOne
👉 Visit asbfinance.in for more trading insights