In the dynamic world of stock market trading, understanding market sentiment and anticipating price movements are critical for success. One powerful tool that traders often overlook is the Open Interest Profile Indicator. Whether you are trading options, futures, or derivatives, mastering open interest analysis can significantly improve your trading decisions.
In this guide, we’ll break down what the Open Interest Profile Indicator is, how it works, and why it should become a crucial part of your trading strategy.
What is the Open Interest Profile Indicator?
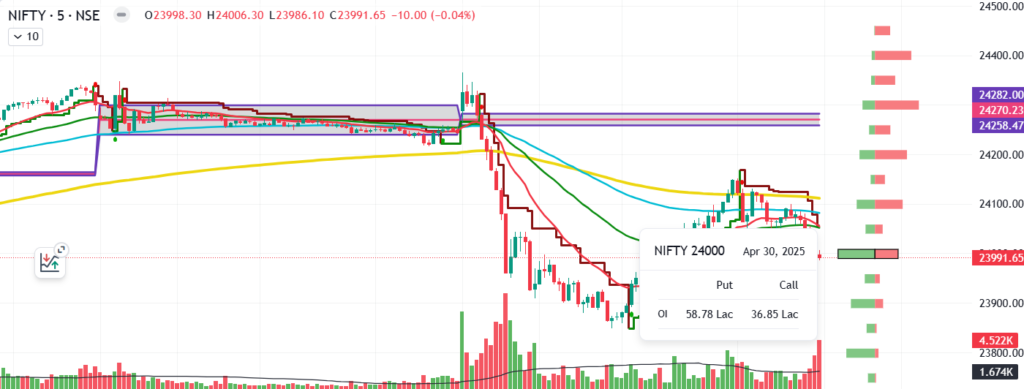
Open Interest (OI) refers to the total number of outstanding contracts (options or futures) that have not been settled. It provides insight into the flow of money into or out of a particular asset. The Open Interest Profile Indicator visualizes this data across different strike prices and expiry dates, giving traders a real-time glimpse into where the market participants are most active.
Unlike volume, which measures trading activity during a specific period, open interest shows the number of open contracts at the end of the day. A rising open interest indicates that new money is entering the market, suggesting strength in the current trend. Conversely, falling open interest may signal that the existing trend is losing momentum.
How Open Interest Profile Indicator Helps in Making Better Trading Decisions
1. Identifying Market Trends
One of the major uses of the Open Interest Profile Indicator is to identify whether the market is trending or consolidating.
- Increasing Price + Increasing Open Interest = Strong Uptrend
- Decreasing Price + Increasing Open Interest = Strong Downtrend
- Flat Price + Decreasing Open Interest = Market Consolidation
By observing the change in OI alongside price movement, traders can gauge the strength behind a price trend.
2. Spotting Support and Resistance Levels
The Open Interest Profile Indicator helps pinpoint strong support and resistance zones.
For example:
- A high open interest at a particular strike price can act as a resistance for call options.
- A high open interest at a put option strike price can act as a support level.
When price approaches these key levels, traders can anticipate potential reversals or breakouts, making it easier to plan entries and exits.
3. Understanding Trader Sentiment
An increasing open interest in calls relative to puts (Put/Call Ratio) can indicate bullish sentiment, while higher open interest in puts may show bearishness.
Analyzing the open interest distribution helps traders understand where the majority of the market is positioned and adapt strategies accordingly.
4. Confirming Breakouts and Breakdowns
False breakouts are a common trap for traders. The Open Interest Profile Indicator helps validate whether a breakout is genuine:
- A breakout with rising open interest suggests strong participation and a higher chance of trend continuation.
- A breakout with falling open interest indicates a lack of conviction, signaling a possible false move.
5. Risk Management and Position Sizing
OI data also supports better risk management. If you notice unusually high OI build-up without much price movement, it can hint at upcoming volatility. Traders can use this information to adjust position sizes, set tighter stop losses, or hedge their portfolios.
Practical Example: Using Open Interest Profile for Trading
Suppose Stock XYZ is trading at ₹1000. The Open Interest Profile shows significant build-up at the 1020 Call option and 980 Put option.
- If the price starts moving above 1020 with increasing OI, it may confirm an upside breakout.
- If the price breaks below 980 with a rise in OI at lower strike puts, it could indicate a strong downtrend.
A trader using this information could confidently decide to go long or short, with clear targets and stop-losses based on OI clusters.
Open Interest Profile: A Must-Have Tool for Every Trader
Today’s successful traders use a data-driven approach to decision-making. The Open Interest Profile Indicator delivers actionable insights that go beyond simple price charts.
When combined with other indicators like volume analysis, moving averages, or momentum oscillators, the Open Interest Profile enhances your ability to anticipate moves and manage trades more effectively.
Conclusion: Power Your Trades with Open Interest Analysis
Trading without considering open interest is like driving without a map.
The Open Interest Profile Indicator empowers you to make smarter, faster, and more informed decisions by:
✅ Identifying market trends
✅ Spotting key support and resistance levels
✅ Understanding sentiment shifts
✅ Confirming real breakouts
✅ Enhancing risk management
At ASB Finance, in partnership with Angel One Limited, we believe in equipping our traders with the best tools and knowledge. Incorporate open interest analysis into your trading plan and elevate your success rate in the stock market.
Ready to supercharge your trading journey?
Open your Demat and Trading account with us today at asbfinance.in and get access to advanced trading platforms, premium research, and personalized guidance!